[Study] The Most Dangerous Intersections in Missouri
[Study] The Most Dangerous Intersections in Missouri
While road safety has improved dramatically in recent years, intersections can still be a dangerous place for drivers. In fact, thousands of people are injured in motor vehicle collisions at intersections throughout the state of Missouri every year.
Which intersections in the state present the greatest risk to drivers? Our team of personal injury attorneys in Kansas City, MO worked with data visualization firm 1Point21 Interactive to help us analyze nearly 150,000 crash records to find out.
Together, we analyzed collision data from the Missouri State Highway Patrol in 2018 (the latest full year available), isolated all crashes that occurred at an intersection, and applied a weighted score to each crossing based on how serious the injuries were in each crash.
Below, we identify the most dangerous intersections in Missouri.
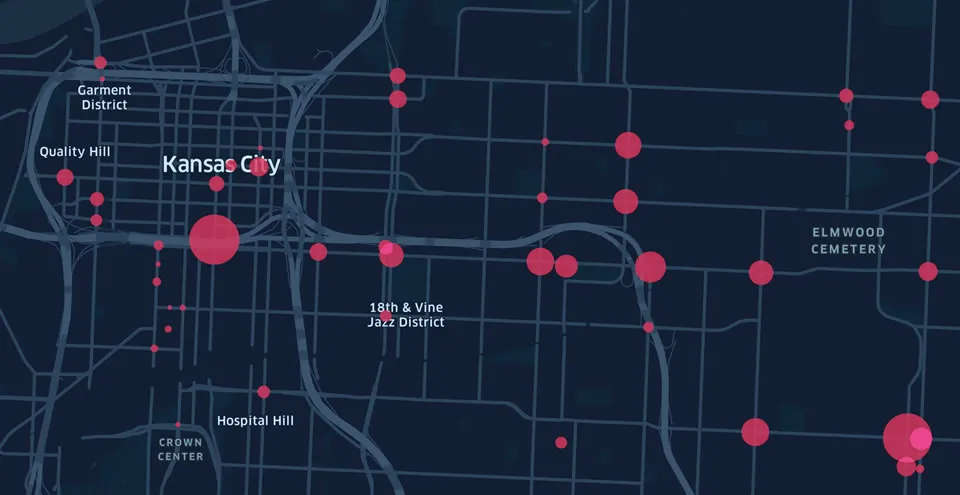
[Interactive Map]
The map below is interactive. Use the mouse wheel or touch gestures to zoom in and out. Each circle on the map represents an intersection where at least six collisions occurred in 2018. Hover over or click the circle to reveal more information.
Most Dangerous Intersections
Dangerous intersections are defined in this study as crossings where both a high number of collisions and injuries occur. Whether it’s due to dangerous conditions, traffic volume, or any other factor, drivers at these intersections are more likely to be involved in a serious collision.
As the basis of our study, we identified 577 intersections where six or more crashes occurred during the study period, then accounted for the number and severity of injuries incurred in those crashes.
Based on this methodology, the most dangerous intersection in Missouri is Oak Street and Truman Road in Kansas City.
This intersection saw 28 crashes and 29 total injuries in a single year, the most injuries and second most crashes of any crossing in our study.
Kansas City was home to all three of the most dangerous intersections and four of the top ten.
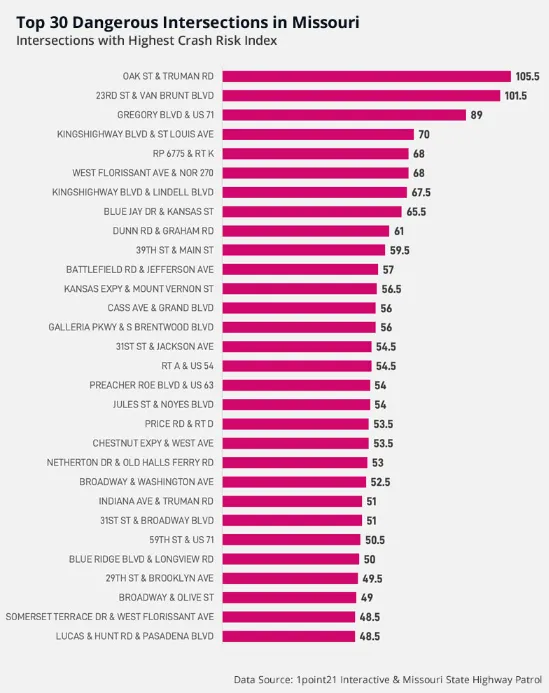
The table below includes more information and lists the 100 most dangerous intersections in Missouri, along with the total number of crashes, injuries, and fatalities. Intersections are ranked by their Crash Risk Index score (CRI), a figure that weighs both collision volume and injury severity.
The higher the CRI score, the more dangerous that intersection is. Only intersections where six or more collisions occurred were considered for inclusion in the list.
Table definitions:
- Crashes: Total number of crashes at this intersection
- MI: Minor Injuries
- VI: Visible Injuries
- SI: Serious Injuries
- Ftl: Number of total fatalities
- CRI: Crash Risk Index
| Rank | Road 1 | Road 2 | City | Crashes | MI | SI | FTL | CRI |
|---|---|---|---|---|---|---|---|---|
| 1 | OAK ST | TRUMAN RD | KANSAS CITY | 28 | 28 | 1 | 0 | 105.5 |
| 2 | 23RD ST | VAN BRUNT BLVD | KANSAS CITY | 24 | 28 | 1 | 0 | 101.5 |
| 3 | GREGORY BLVD | US 71 | KANSAS CITY | 24 | 18 | 0 | 2 | 89 |
| 4 | KINGSHIGHWAY BLVD | ST LOUIS AVE | ST. LOUIS | 20 | 17 | 1 | 0 | 70 |
| 5 | RP 6775 | RT K | OFALLON | 28 | 16 | 0 | 0 | 68 |
| 6 | WEST FLORISSANT AVE | NOR 270 | NON-CITY OR UNINCORPORATED | 23 | 18 | 0 | 0 | 68 |
| 7 | KINGSHIGHWAY BLVD | LINDELL BLVD | ST. LOUIS | 20 | 12 | 1 | 1 | 67.5 |
| 8 | BLUE JAY DR | KANSAS ST | LIBERTY | 23 | 11 | 2 | 0 | 65.5 |
| 9 | DUNN RD | GRAHAM RD | FLORISSANT | 16 | 18 | 0 | 0 | 61 |
| 10 | 39TH ST | MAIN ST | KANSAS CITY | 17 | 17 | 0 | 0 | 59.5 |
| 11 | BATTLEFIELD RD | JEFFERSON AVE | SPRINGFIELD | 12 | 18 | 0 | 0 | 57 |
| 12 | KANSAS EXPY | MOUNT VERNON ST | SPRINGFIELD | 14 | 7 | 2 | 1 | 56.5 |
| 13 | CASS AVE | GRAND BLVD | ST. LOUIS | 11 | 9 | 3 | 0 | 56 |
| 14 | GALLERIA PKWY | S BRENTWOOD BLVD | RICHMOND HEIGHTS | 6 | 5 | 5 | 0 | 56 |
| 15 | 31ST ST | JACKSON AVE | KANSAS CITY | 12 | 10 | 1 | 1 | 54.5 |
| 16 | RT A | US 54 | NULL | 7 | 13 | 2 | 0 | 54.5 |
| 17 | PREACHER ROE BLVD | US 63 | WEST PLAINS | 9 | 12 | 2 | 0 | 54 |
| 18 | JULES ST | NOYES BLVD | ST. JOSEPH | 9 | 18 | 0 | 0 | 54 |
| 19 | PRICE RD | RT D | OVERLAND | 11 | 17 | 0 | 0 | 53.5 |
| 20 | CHESTNUT EXPY | WEST AVE | SPRINGFIELD | 6 | 13 | 2 | 0 | 53.5 |
| 21 | NETHERTON DR | OLD HALLS FERRY RD | NON-CITY OR UNINCORPORATED | 8 | 15 | 1 | 0 | 53 |
| 22 | BROADWAY | WASHINGTON AVE | ST. LOUIS | 20 | 13 | 0 | 0 | 52.5 |
| 23 | INDIANA AVE | TRUMAN RD | KANSAS CITY | 11 | 7 | 3 | 0 | 51 |
| 24 | 31ST ST | BROADWAY BLVD | KANSAS CITY | 11 | 13 | 1 | 0 | 51 |
| 25 | 59TH ST | US 71 | KANSAS CITY | 13 | 15 | 0 | 0 | 50.5 |
| 26 | BLUE RIDGE BLVD | LONGVIEW RD | KANSAS CITY | 10 | 16 | 0 | 0 | 50 |
| 27 | 29TH ST | BROOKLYN AVE | KANSAS CITY | 7 | 13 | 0 | 1 | 49.5 |
| 28 | BROADWAY | OLIVE ST | ST. LOUIS | 14 | 11 | 1 | 0 | 49 |
| 29 | SOMERSET TERRACE DR | WEST FLORISSANT AVE | FERGUSON | 11 | 12 | 1 | 0 | 48.5 |
| 30 | LUCAS & HUNT RD | PASADENA BLVD | NORTHWOODS | 6 | 8 | 3 | 0 | 48.5 |
| 31 | CHAMBERS RD | WEST FLORISSANT AVE | DELLWOOD | 18 | 12 | 0 | 0 | 48 |
| 32 | 75TH ST | WARD PKWY | KANSAS CITY | 30 | 7 | 0 | 0 | 47.5 |
| 33 | 4TH ST | WASHINGTON AVE | ST. LOUIS | 20 | 8 | 1 | 0 | 47.5 |
| 34 | LITTLE BLUE PKWY | US 40 | INDEPENDENCE | 17 | 12 | 0 | 0 | 47 |
| 35 | NOR 64 | RT K | OFALLON | 11 | 14 | 0 | 0 | 46 |
| 36 | PVT MONTAUK DR | US 67 | NON-CITY OR UNINCORPORATED | 11 | 10 | 0 | 1 | 46 |
| 37 | 75TH ST | TROOST AVE | KANSAS CITY | 18 | 11 | 0 | 0 | 45.5 |
| 38 | 45TH ST | MADISON AVE | KANSAS CITY | 13 | 7 | 2 | 0 | 45.5 |
| 39 | JENNINGS STATION RD | MO 367 | JENNINGS | 8 | 9 | 2 | 0 | 45.5 |
| 40 | 85TH ST | WARD PKWY | KANSAS CITY | 20 | 10 | 0 | 0 | 45 |
| 41 | LITTLE BRENNAN RD | MO 30 | NON-CITY OR UNINCORPORATED | 10 | 8 | 2 | 0 | 45 |
| 42 | BATTLEFIELD RD | GOLDEN AVE | SPRINGFIELD | 7 | 9 | 2 | 0 | 44.5 |
| 43 | 63RD ST | ROCKHILL RD | KANSAS CITY | 14 | 9 | 1 | 0 | 44 |
| 44 | 23RD ST | JACKSON AVE | KANSAS CITY | 9 | 14 | 0 | 0 | 44 |
| 45 | NATIONAL AVE | SUNSET ST | SPRINGFIELD | 9 | 14 | 0 | 0 | 44 |
| 46 | PROSPECT AVE | TRUMAN RD | KANSAS CITY | 11 | 7 | 2 | 0 | 43.5 |
| 47 | HOLMES RD | RED BRIDGE RD | KANSAS CITY | 11 | 10 | 1 | 0 | 43.5 |
| 48 | ARSENAL AVE | KINGSHIGHWAY BLVD | ST. LOUIS | 11 | 6 | 1 | 1 | 43.5 |
| 49 | 55TH ST | US 71 | KANSAS CITY | 11 | 13 | 0 | 0 | 43.5 |
| 50 | NORTHWEST BLVD | MO 30 | NON-CITY OR UNINCORPORATED | 6 | 9 | 2 | 0 | 43.5 |
| 51 | DELMAR BLVD | KINGSHIGHWAY BLVD | ST. LOUIS | 13 | 12 | 0 | 0 | 43 |
| 52 | PROSPECT AVE | SWOPE PKWY | KANSAS CITY | 13 | 12 | 0 | 0 | 43 |
| 53 | 35TH ST | EUCLID AVE | KANSAS CITY | 8 | 7 | 1 | 1 | 43 |
| 54 | BATES ST | GRAND BLVD | ST. LOUIS | 8 | 8 | 2 | 0 | 43 |
| 55 | GRAND BLVD | PAGE BLVD | ST. LOUIS | 8 | 5 | 3 | 0 | 43 |
| 56 | CAMPBELL AVE | W GRAND ST | SPRINGFIELD | 12 | 9 | 1 | 0 | 42 |
| 57 | CLEAVER II BLVD | ELMWOOD AVE | KANSAS CITY | 12 | 12 | 0 | 0 | 42 |
| 58 | FORT AVE | SUNSHINE ST | SPRINGFIELD | 7 | 5 | 3 | 0 | 42 |
| 59 | FRONT ST | MO 47 | TROY | 7 | 11 | 1 | 0 | 42 |
| 60 | 63RD ST | PROSPECT AVE | KANSAS CITY | 19 | 9 | 0 | 0 | 41.5 |
| 61 | BROADWAY BLVD | GRAND AVE | SEDALIA | 14 | 11 | 0 | 0 | 41.5 |
| 62 | BELLEFONTAINE RD | NOR 270 | NON-CITY OR UNINCORPORATED | 11 | 9 | 1 | 0 | 41 |
| 63 | 9TH ST | BENTON BLVD | KANSAS CITY | 11 | 12 | 0 | 0 | 41 |
| 64 | 39TH ST | TROOST AVE | KANSAS CITY | 11 | 12 | 0 | 0 | 41 |
| 65 | HALLS FERRY RD | JENNINGS STATION RD | JENNINGS | 13 | 5 | 2 | 0 | 40.5 |
| 66 | BELT HWY | FARAON ST | ST. JOSEPH | 8 | 7 | 2 | 0 | 40.5 |
| 67 | MILL ST | RT A | FESTUS | 12 | 11 | 0 | 0 | 39.5 |
| 68 | GOODFELLOW BLVD | NATURAL BRIDGE AVE | ST. LOUIS | 12 | 11 | 0 | 0 | 39.5 |
| 69 | GREGORY BLVD | THE PASEO | KANSAS CITY | 7 | 10 | 1 | 0 | 39.5 |
| 70 | 39TH ST | SOUTHWEST TRFY | KANSAS CITY | 14 | 10 | 0 | 0 | 39 |
| 71 | NATURAL BRIDGE AVE | VANDEVENTER AVE | ST. LOUIS | 9 | 9 | 1 | 0 | 39 |
| 72 | GRAND BLVD | NATURAL BRIDGE AVE | ST. LOUIS | 11 | 8 | 1 | 0 | 38.5 |
| 73 | 14TH ST | MARKET ST | ST. LOUIS | 6 | 10 | 1 | 0 | 38.5 |
| 74 | GLENSTONE AVE | RP 988739 | SPRINGFIELD | 6 | 7 | 2 | 0 | 38.5 |
| 75 | CHESTNUT EXPY | GRANT AVE | SPRINGFIELD | 8 | 12 | 0 | 0 | 38 |
| 76 | 39TH ST | INDIANA AVE | KANSAS CITY | 8 | 12 | 0 | 0 | 38 |
| 77 | 12TH ST | BENTON BLVD | KANSAS CITY | 8 | 12 | 0 | 0 | 38 |
| 78 | 51ST ST | SWOPE PKWY | KANSAS CITY | 10 | 11 | 0 | 0 | 37.5 |
| 79 | THE PASEO | TRUMAN RD | KANSAS CITY | 12 | 10 | 0 | 0 | 37 |
| 80 | GREEN PARK RD | REAVIS BARRACKS RD | NON-CITY OR UNINCORPORATED | 12 | 7 | 1 | 0 | 37 |
| 81 | JACKSON AVE | TRUMAN RD | KANSAS CITY | 12 | 10 | 0 | 0 | 37 |
| 82 | GRAVOIS RD | MO 30 | NON-CITY OR UNINCORPORATED | 7 | 9 | 1 | 0 | 37 |
| 83 | KEARNEY ST | NATIONAL AVE | SPRINGFIELD | 7 | 9 | 1 | 0 | 37 |
| 84 | MO 141 | RP 105775 | TOWN AND COUNTRY | 7 | 6 | 2 | 0 | 37 |
| 85 | 4TH ST | SPRUCE ST | ST. LOUIS | 14 | 6 | 1 | 0 | 36.5 |
| 86 | EVELINE ST | HAMPTON AVE | ST. LOUIS | 14 | 9 | 0 | 0 | 36.5 |
| 87 | CAMPBELL AVE | WALNUT LAWN ST | SPRINGFIELD | 9 | 8 | 1 | 0 | 36.5 |
| 88 | DE BALIVIERE AVE | FOREST PARK PKWY | ST. LOUIS | 9 | 8 | 1 | 0 | 36.5 |
| 89 | MO 180 | RT EE | BRECKENRIDGE HILLS | 9 | 2 | 3 | 0 | 36.5 |
| 90 | NATURAL BRIDGE AVE | UNION BLVD | ST. LOUIS | 9 | 11 | 0 | 0 | 36.5 |
| 91 | FLINTLOCK RD | MO 152 | KANSAS CITY | 16 | 8 | 0 | 0 | 36 |
| 92 | ASH AVE | MO 291 | LIBERTY | 6 | 6 | 2 | 0 | 36 |
| 93 | E GRAND ST | GLENSTONE AVE | SPRINGFIELD | 6 | 12 | 0 | 0 | 36 |
| 94 | ROANOKE PKWY | WARD PKWY | KANSAS CITY | 23 | 5 | 0 | 0 | 35.5 |
| 95 | 27TH ST | JACKSON AVE | KANSAS CITY | 18 | 7 | 0 | 0 | 35.5 |
| 96 | 89TH ST | TROOST AVE | KANSAS CITY | 8 | 11 | 0 | 0 | 35.5 |
| 97 | BROADWAY | WARD PKWY | KANSAS CITY | 17 | 7 | 0 | 0 | 34.5 |
| 98 | INDIANA AVE | LINWOOD BLVD | KANSAS CITY | 7 | 11 | 0 | 0 | 34.5 |
| 99 | 99TH ST | BLUE RIDGE BLVD | KANSAS CITY | 7 | 11 | 0 | 0 | 34.5 |
| 100 | 72ND ST | MO 1 | GLADSTONE | 7 | 5 | 2 | 0 | 34.5 |
Total Number of Dangerous Intersections by City & County
When broken down by city, Kansas City led the way with a total of 189 intersections with six or more crashes. (163 in Jackson County, 21 in Clay, and 5 in Platte). St Louis was second with 107 dangerous intersections, and Springfield was 3rd with 28. The table below shows all cities where at least high-crash intersections were present.
| City | County | Dangerous Intersections |
|---|---|---|
| KANSAS CITY | JACKSON | 163 |
| ST. LOUIS | ST. LOUIS CITY | 107 |
| SPRINGFIELD | GREENE | 28 |
| KANSAS CITY | CLAY | 21 |
| NON-CITY OR UNINCORPORATED | ST. LOUIS | 21 |
| ARNOLD | JEFFERSON | 11 |
| OFALLON | ST. CHARLES | 10 |
| ST. PETERS | ST. CHARLES | 10 |
| JOPLIN | JASPER | 8 |
| LEES SUMMIT | JACKSON | 8 |
| BLUE SPRINGS | JACKSON | 7 |
| FLORISSANT | ST. LOUIS | 7 |
| MARYLAND HEIGHTS | ST. LOUIS | 7 |
| FENTON | ST. LOUIS | 6 |
| LIBERTY | CLAY | 6 |
| NON-CITY OR UNINCORPORATED | JEFFERSON | 6 |
| RICHMOND HEIGHTS | ST. LOUIS | 6 |
| ST. JOSEPH | BUCHANAN | 6 |
| CAPE GIRARDEAU | CAPE GIRARDEAU | 5 |
| FESTUS | JEFFERSON | 5 |
| INDEPENDENCE | JACKSON | 5 |
| KANSAS CITY | PLATTE | 5 |
| RAYTOWN | JACKSON | 5 |
| WEST PLAINS | HOWELL | 5 |
| BRANSON | TANEY | 4 |
| FERGUSON | ST. LOUIS | 4 |
| SEDALIA | PETTIS | 4 |
| ST. CHARLES | ST. CHARLES | 4 |
The Big Three: Kansas City, St. Louis, and Springfield
As mentioned previously, Kansas City, St. Louis, and Springfield had far and away the most potentially dangerous intersections. Which crossings are the most dangerous in each city?
The Five Most Dangerous Intersections in Kansas City
- Oak Street and Truman Road: 28 crashes and 29 injuries
- 23rd Street and Van Brunt Blvd: 24 crashes and 29 injuries
- Gregory Boulevard & US 71: 24 crashes, 18 injuries, and 2 fatalities
- 39th Street & Main Street: 17 crashes and 17 injuries
- 31st Street and Jackson Avenue: 12 crashes, 11 injuries, and 1 fatality
The Five Most Dangerous Intersections in St. Louis
- Kingshighway Boulevard and St. Louis Avenue: 20 crashes and 18 injuries
- Kingshighway Boulevard and Lindell Blvd: 20 crashes, 13 injuries, and 1 fatality
- Cass Avenue and Grand Boulevard: 11 crashes and 13 injuries
- Broadway and Washington Avenue: 20 crashes and 13 injuries
- Broadway and Olive Street: 14 crashes and 12 injuries
The Five Most Dangerous Intersections in Springfield
- Battlefield Road and Jefferson Avenue: 12 crashes and 18 injuries
- Kansas Expressway and Mount Vernon Street: 14 crashes, 9 injuries, and 1 fatality
- Chestnut Expressway and West Avenue: 6 crashes, 13 injuries, and 2 fatalities
- Battlefield Road and Golden Avenue: 7 crashes and 11 injuries.
- National Avenue and Sunset Street: 9 crashes and 14 injuries
Total by Intersection Type
Which types of intersections involve the highest rate of injury? We found that drivers should be extra cautious when using four and five-way intersections.
- 4-Way Intersections: 58% of crashes involve injuries
- T-Intersections: 44% of crashes involve injuries
- Roundabouts: 16% of crashes involve injuries
- Y-Intersections: 36% of crashes involve injuries
- 5-Way or more: 62% of crashes involve injuries
- Others: 47% of crashes involve injuries
The table below shows the statistics for crashes at each intersection type.
| IntersectionType | Crashes | Minor Injuries | Major Injuries | Total Injuries | Fatalities |
|---|---|---|---|---|---|
| 4-Way | 20257 | 10966 | 779 | 11743 | 90 |
| T-Intersection | 7778 | 3188 | 262 | 3450 | 49 |
| Other | 1100 | 460 | 58 | 519 | 4 |
| Roundabout | 467 | 70 | 5 | 75 | 2 |
| Y-Intersection | 403 | 132 | 14 | 146 | 3 |
| 5-Way or more | 245 | 150 | 2 | 152 | 1 |
Study Notes
Our study does not take traffic volume into account due to figures not being readily available for every intersection in the state during the entire period. While we agree that the level of traffic at each crossing is important, we also believe the collision and injury volume is a very good indicator of danger. It stands to reason, intersections with more crashes are more dangerous than those with fewer crashes.
We feel that this list can help drivers understand the risks on the road around them and adjust their routes or driving behaviors accordingly to keep themselves safe.
*If you would like to republish or share the results of our study or any of the visual elements contained within, please provide attribution by linking to this page.
Visit Our Kansas City Personal Injury Law Office
4520 Main Street, Suite 1000, Kansas City, MO 64111, United States
Schedule Your Free Case Evaluation
” * ” Indicates Required Fields
© Copyright 2026 Wendt Law Firm P.C.. All rights reserved.
